Modern Real World Cycling Aerodynamics

Cycling aerodynamics in recent times has been dominated by “wind tunnel data” used by vendors to highlight the benefits of their particular wheel or frameset. This data has often been shrouded in marketing spin accompanied by some lavish blurb about yaw angles. However, there has been a recent trend towards discounting this data or at least placing less emphasis on it.
Introduction
Essentially a wind tunnel replicates a flow condition which mirrors the diagram shown below
- Flow Is straight and Parallel
- The bike is fixed on a turntable
- The rider is asked to maintain a steady cadence
- The steering angle is fixed
- The natural tendency of the bike to roll during pedaling is constrained by fixing the front and rear axles, similar to a turbo trainer
- In more advanced setups the bike wheels are placed onto a tread mill type device to simulate road speed
- Measurement is accurate

The real world is quite different.
- Oncoming airflow is random and haphazard
- The rider cadence will be chosen by the rider for that particular moment in time
- The steering is free to be moved
- Any rolling motion is unconstrained
- It is generally not repeatable

This post covers the engineering behind the methods in relatively simple language and methodology
Conventional Methods (Steady State) the “Wind Tunnel Test”
Steady state testing involves testing an object at various angles of yaw and then calculating the drag using a basic Bernoulii’s equation (this is considered to be valid where flow is incompressible). Please be aware that the majority of this text uses Cd as opposed to CdA.
This is then expanded to take into account the yaw angle of the rider in relation to wind. Note the Area term (A), often labelled (S) will vary so the assumption of using a fixed value of A is in itself an oversimplification that compromises accuracy.
To obtain the power, the drag is multiplied by velocity, some sources quote velocity separately for air and rider speed, for the purposes of this post, they are assumed to be equal.
There are some severe limitations with this method. The most frequently ignored issue is the drop in forward velocity. When the rider is rotated at any angle away from head on (zero yaw), the relative wind speed drops. As an example, consider a test conducted at 50km/h wind speed. If the rider were to be rotated to 15 degrees, the velocity relative to the rider would be 48.3km/h. A 1.7km/h reduction might not sound like much but this value is squared for drag and cubed for power, it becomes a 7% drag reduction and 11% power reduction, putting that into wattage terms 400W would become ~356W. This is the principle reason why many graphs supplied by vendors show a reduction in drag when the rider is rotated away from zero yaw.
The principle drag equation that is often cited neglects a CL2 term. This is derived from the drag polar and is used for aerofoils and objects that generate lift. The parasitic drag is termed CD0 and the lift induced component is that within the squared brackets. This is shown below
Cycle riders will often describe something known as the sail effect, this is the drag polar in full effect. As an aerofoil generates lift, it also generates drag. This is called lift-induced drag. It is very common on deep wheels and it is very apparent in acute cross winds. This term is almost always neglected or simply incorporated into the overall drag coefficient formula. There is debate in advanced aerodynamic quarters as to whether assuming a constant drag coefficient with respect to angle is valid, the general consensus is when it is used for a future derivation (i.e. a prediction of performance) it is invalid.
Substituting all of these variables in, a more comprehensive equation for drag estimation is shown below – this equation is particularly relevant to wheels
The majority of wheel suppliers do not account for the variation in Cd detailed above but Hunt wheels to their credit have listed this in their wheel test. It is buried in the detail and it’s likely that that most visitors would gloss over the key statement:
The formula is only valid under the assumption that the measured coefficient of drag for small changes in speed is independent of the Reynolds number
Hunt Wheels
A widely discussed but rarely documented limitation is a propensity for detachment (colloquially called stall, technically it’s not a complete stall on a wheel as some flow often remains attached). The angle of stall should in theory be a constant for a given wheel but in reality it is different depending on whether the rider yaw angle is moving towards head on or away from it, American texts generally refer to this as sweep, in Europe it is called incidence. The graphs below have no correction for relative velocity.


The difference between moving towards and moving away from head on is quite obvious. From a purely engineering perspective and to model reality, the publication of the “moving away from head on” is a more realistic scenario BUT bike marketing in general will publish the “moving away from head on” as it is more favorable.
Dnitriev Methods (Field Test)
In 2020, one of the first wheels to be tested using the Dnitriev concept was the Winspace Hyper. This wheel and brand was largely unknown outside of China. Forced closure of wind tunnels due to the COVID pandemic accelerated the move towards Dnitriev testing and essentially there was little other choice to establish Aerodynamic prowess. The testing showed the wheels were significantly faster than any other wheel of that class. This was supplemented by other reviews from other sources of the same wheel and the consensus was they were the fastest 50mm wheels around. The concept of Dnitriev testing was encouraging but not yet proven.
Time has progressed and other wheels have also been tested using the same methodology. Farsports, KPS, Trifox and Zipp.
The fundamental concept of Dnitriev theory is to work out how stable or unstable an object becomes when it is subject to flow that is transient in nature. It was originally used to develop the aerodynamics for the MIG-29 aircraft by the then chief engineer Aleksandr Dnitriev. A documentary detailing the process of building the aircraft along with discussion about the aerodynamics is available on YouTube. In the 1970’s, fast acting control computers and systems did not exist so he had to develop the aircraft to be agile but also stable. Modern military aircraft are inherently unstable (to make them more nimble), they are only controllable by the onboard computers which make constant adjustments to the control surfaces to keep them airborne.
The same theory has now been applied to wheels (with various tweaks). The exact mapping is considered commercially sensitive material and is not shared in this post. The concept is however identical. Wheels that exhibit a tendency to become unstable – ie large build ups of pressure and then collapse are inherently less aerodynamic than those that don’t have the large pressure build ups, the driver variable being the intensity of the local and global flow vectors. In general terms, a wheel that is deeper will become less aerodynamic (and stable) when it becomes more gusty. The caveat is the type of gust – A constant cross wind is a steady state condition (DNV is near 0) and is unachievable, there is always a slight tendency for the front wheel to move and the rotation of the spokes in itself generates turbulence, a fluctuating cross wind is a transient condition and increases DNV.
The key difference between DNV and steady state are the derivatives with respect to time which indicate a variation in angle and speed.
Example Winspace Hyper 50mm vs Farsports Ventoux 56mm vs AliExpress 35mm
The king of the 50mm depth class has long been the Winspace Hyper. Unlike most wheels, it is comparatively narrow and the trailing edge of the rim is not as blunt as it’s contemporaries. It is plotted here against the FarSports Ventoux 56mm and a Generic AliExpress 35mm, the farsports wheel has extremely deep bladed carbon spokes and semi hidden nipples.
Please note the graph below has some approximations to make rendering faster, use it for guidance and not as a de facto performance value.
The limit for stability is about 1.0. A criterion value exceeding 1.0 is likely to be unstable to the point where a rider would have their forward momentum compromised by corrections resulting from instability. The exact number will vary depending on rider but essentially beyond that level the bike becomes very difficult to ride. Despite their differing approaches, the limit stability in both cases is about DNV=35. They both regain stability after after DNV=3000. This is primarily driven by the depth of the wheel.
In contrast the 35mm open mould wheel remains stable up to DNV=250 and regains stability at DNV=1800. See further below.
Hence if it is was a very blustery day, the 35mm wheel would be a superior choice. Common sense would normally sway a rider into this choice given the option, Dnitriev analysis simply qualifies it.
The key takeaway is there is unlikely to be a wheel that is faster in all conditions. For the majority of situations a 50mm wheel will give the best compromise between low transience wind and stability performance.
A typical DNV plot with no offset correction and log axis is shown below. The key thing to note is as the level of turbulence increases, the wheel can be in multiple states of stability or instability. At low DNV the deviation in stability criterion is limited, the range gets broader as DNV increases
Instability visualized
The two diagrams below show the same wheel/tire combination at the same yaw angle. The difference is purely a schematic of a single point in time. At the same angle and apparent flow conditions, the wheel can be in a state of attached or detached flow. Transient analysis takes this into account but steady state does not – the wheel would either be attached or detached. Conceptually, the air pressure gradient between the high pressure side and low pressure reaches a point where the differential can no longer be maintained and it collapses with pressure equalisation with the movement of air from the high pressure side to the low pressure side. The collapse causes a counter rotating torque which may be perceived to be instability. The key learning is that the air pressure gradient build up can often be measured in seconds, the collapse is instantaneous. The caveat is this is dependent on a multitude of factors, primarily angle, speed and section geometry. This build of pressure and collapse with the corresponding shedding of vortices (development pictured in the collapsed diagram) causes high amounts of drag.
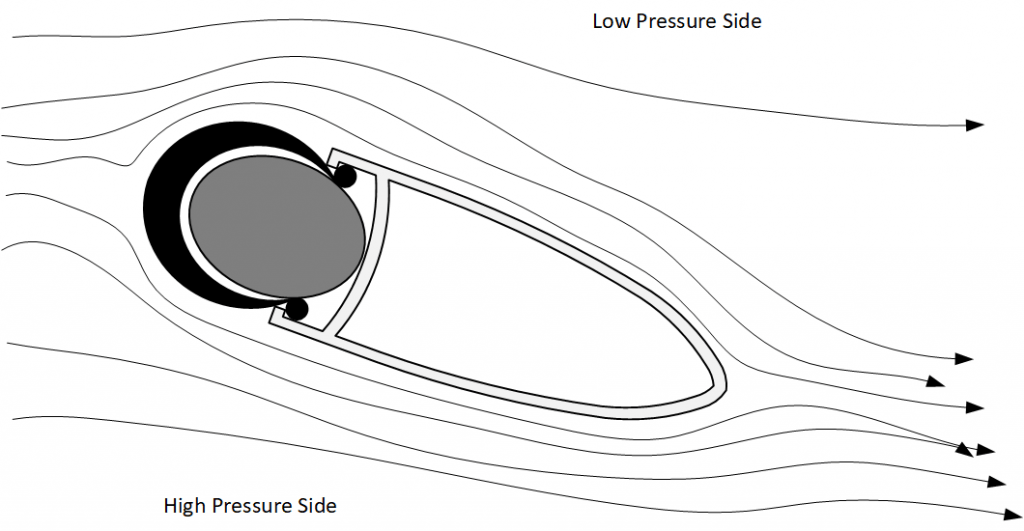
The diagram below is the same section at the same angle. Note the leakage and vortex generation at the trailing edge.
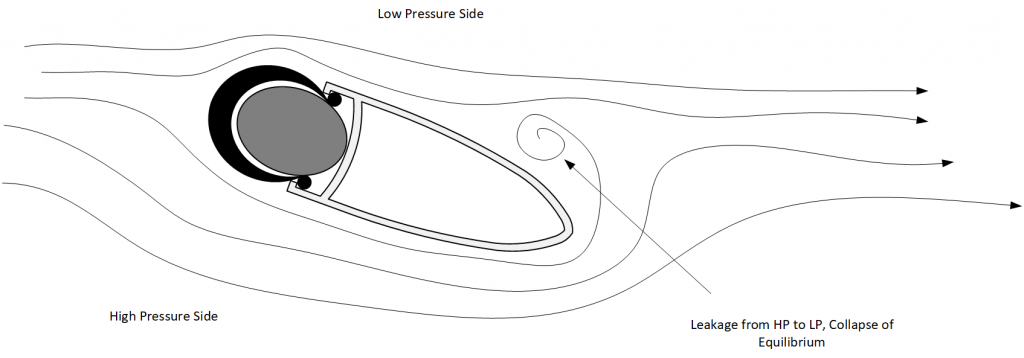
The above explanation is highly simplified, the aim is to illustrate that airflow can be in multiple perceived states at what appear to be at identical angles. Minor deviations in steering angle and rider velocity can (and usually do) cause some level of instability.
A very public display of flow instability was during the testing phase for the 2022 Formula 1 season. Cars were enduring high vertical frequency vibration along straights with flow collapsing. Despite the considerable wind tunnel and CFD resources, none of the teams predicted this. Ground effect cars were last used in the eighties and even with advances in Engineering, the “porpoise effect” was not able to be predicted or at the time of writing engineered out.
Field Test vs Wind Tunnel
The clear advantage with a field test is obvious, the conditions are real, the airflow is random and the rider’s movements are real and natural. There are some disadvantages, the regimen for Dnitriev testing is not well established (for bikes), the error is higher and claiming repeatability is essentially impossible (you cannot guarantee two exactly similar conditions at any point in time). This somewhat offset as there are so many data points collected that they tend to swarm and the patterns develop (See above “typical DNV plot”). It is however extremely cheap to carry out in comparison to wind tunnel test time once the initial measurement equipment has been purchased.
One particular issue is the conversion of Dinitriev plots to power consumption, a figure that many cyclists are used to. At the time of writing, no agreed standard exists.
Wind tunnel testing is useful for riders who are going extremely fast (50km/h+) or optimizing for a velodrome. In any other scenario, unless the wind tunnel test is transient – it has limited value outside as airflow is never straight and parallel. The results from steady state wind tunnels are generally highly contentious, companies are often using wind speeds that are largely unattainable by the average cyclist and then scaling down to compute “time saved over 40km” as a measure of aerodynamic prowess. A few events where the flow collapses can often negate any perceived systemic aerodynamic advantage in steady state conditions.
Manufacturers Response
The big manufacturers, in particular ZIPP appear to be moving away from wind tunnels, the market has become wise to this data and they are placing much more emphasis on “tested in the field”. Roval, who are Specialized’s in house brand, has an open loop wind tunnel at their facility in California, It’s likely they will continue to push wind tunnels in their marketing. Bontrager who are probably the third of the large wheel companies have also shifted towards emphasis on field testing.
The methods these companies use for field testing is undocumented and it is unlikely that this will every be publicly shared. They often supply some marketing photographs with a rider using a pressure rake but this is the limit of freely available information.
The emerging companies from China. Winspace, Lightbicycle, Farsports, ICAN are using a mix of field testing (Pressure Rakes/Dinitriev) and CFD. The major advantage these companies have is a wheel is as much a structural engineering problem as it is an aerodynamic engineering problem and being in control of the manufacturing gives them a commercial advantage. Winspace and Farsports have largely gotten their aerodynamics sorted and now they are in pursuit of low moments of inertia, hence their wheels are being supplied with shallow nipples and wide bladed carbon spokes. They have probably realized that any further aerodynamic improvement will be incremental and not worth the cost, however the inertia of the wheel is “low hanging fruit” and big gains can be had in these areas for little investment.
Overall
As an engineer looking into this field – purely by chance, it is quite obvious that the engineering has largely gone. It is much more about marketing. The previous pull of the Wind Tunnel as proof has basically evaporated and now cyclists are looking towards other factors – quality of hubs, moment of inertia (rotating mass) and the image and country of origin of the brand that made the wheels etc. There is no dispute that aerodynamic prowess still plays its part but “wind tunnel test” does not carry the weight that it once did.



That was a quite fascinating read. I had not realised how erratic airflow was on a bike.
Will you get doing the same testing on other good performing aero wheels like the clx 64, Aeolus rsl 62, knot 64, or Zipp 404? It would be really interesting to see if there is a larger performance gap between wheels than traditional testing would show
yep it’s more of a time limit than anything else.
Why am I’m reading this in your voice ?
Because it’s sensual.
This is all good stuff! Thank you.
Now, it would be good to have your input on bicycle tire rolling resistance, something I’m studying now. For most riders this is perhaps more fundamental than aero testing bc it applies to any rider. It’s an everyday issue.
In chats with silca support, they say that data produced by bicyclerollingresidtsnce.com testing though static testing, does hold up when follow up Chung Method real world tests are performed. How many tests have been followed up, I don’t know. Also the point being to determine the appropriate tire pressure for the type of ride, ride conditions, and choice of tires. Seems to me that a whole lot more testing and protocol development could be done. Such stuff as casing material properties isn’t fully worked out, but that would be important factors to determine resistance. Silca indicc cx area that even body fat % plays a role, though in my opinion that’s an extraneous factor to the physics and mechanics in rolling resistance. If body fat be part, why then not frame material? Instead of adjusting the pressure in my tires, or switching from butyl to latex tubes, or from poly to corespun cotton, or silk casing, I adjust body composition??
In other chats with the directors of Challenge Tech and FMB-boyaux, both indicate possible gaps in current methodology. Your input would be interesting.
Whatever the direction research takes, the current state of calculators being used provide constraints to the options built into the calculators, but the bottom line takeaway seems to be: marginally under inflated tires (<10psi) cause a much smaller watt penalty that marginally if overinflated. For simple riders like me, and ones that value comfort as much as efficiency, underinflate is perhaps better.
What’s the Hambini take on bicyclerollingresistance data, on Chung Method? Can you neatly explain “virtual elevation”? Other real world testing; the Hambini test?
I don’t really think the Chung method is all that good, there is way too much variability for it to hold up but plenty of people do use it. I’ll probably have to do another post or do a video to cover all of your questions raised but I’ve made a note!
I’m also curious about your future writeup on Chung method.
Great article. Hopefully many more to come.
Why are manufacturers now pursuing low inertia wheels? Mass concentration on a wheel should not affect “spin up speed” due to the more dominant overall system mass of rider+bike.
A rotating mass doesn’t have to be all that heavy to influence the acceleration greatly. The large radius of bike wheels really does hamper that. Farsports as an example is already actively pursuing low inertia wheels and I think it has merit.
Hey Hambini, a question about low vs high rotational. Wouldn’t a high inertial wheel, once rotated up to speed, maintain its rotational momentum better? Is this something to consider or helpful for flat/TT riding where snappy accelerations aren’t as critical?
This strategy works unless you have to press the brake at any point in time. Once that energy is lost, to get it back you will put in more energy than a lightweight wheel. Therefore the theory is fine provided you don’t press the brakes at any point.
Great article!
I have a question about using conventional methods to do your field testing.
Is it valid to use conventional methods for field testing to test improvements/differences in Cda for individual riders?
I understand that there will be quite a bit of error/variability depending on conditions, but in your opinion is it possible to collect usable data?
Thx for the great content!
Thanks! That article was very interesting! I was wondering, what would you recommend for the fastest front wheel for time trial? Also I agree with the comment about tyre, it would be nice to have an article about it.
A front disc would be the fastest. The next issue is if it is too windy for a front disc?
You got me there. If a front disc is not an option, is there a model of wheel that you would recommend? I rode a 90mm front wheel in the past without any problem with the wind. I only have a 50mm at the moment and looking at adding a deeper (or maybe trispoke) wheel for TT but I don’t know what to get.
Pure science here. Congrats..
You post, I’ll read.
Excellent article!!
This article provides real information, and helps to educate us and understand real considerations about the role of the wheels in our bikes.
I wonder how the modern aluminum wheels do perform and compare against carbon wheelsets using the same kind of tests? (modern aluminum wheels with good spects).
“The fundamental concept of Dnitriev theory is to work out how stable or unstable an object becomes when it is subject to flow that is transient in nature”
“The king of the 50mm depth class has long been the Winspace Hype”
If your protocol is correct, Hype will never be the king of the 50 mm depth class. Hype is one of the most unstable wheels in the class, a lot of reports on the Hype thread on ww, and also plenty of complaints on the unstability in China.
loved the article, really interesting stuff. I get crazy from all the companies with their own disc wheels, saying that theirs is the fastest. is there a way to measure which is actually the fastest disc wheel? or is it only for the looks, since the airflow is always the samen with a disc wheel?
There won’t be much difference between disc wheels. The advantage comes from a solid boundary and the rear wheel is less affected
First, I love to read and watch what you publish. I built up a Deng fu frame with Farsports wheels and used Ultegra parts. After your research I might have made some changes.
I have often wondered if bike manufacturers could create a very fast bike that met no rules at all for those cyclists who simply want to go fast and never compete. I am a former racer decades ago and competed at the university level in mileage competitions for cars, so my interest is still keen. What about having no gap in the triangle of the frame? As for side winds, I think it is not a problem. People with frame bags that cover this area have told me it is not problem.
A super fast bike for the masses really would be cool